This article is for informational and educational purposes only. It does not constitute financial advice. Always consult a qualified financial advisor before making any investment decisions.
Goldman Sachs set its year-end 2026 gold price target at $5,400 per troy ounce — and it has held that number even as gold shed more than 10% in a single month. That kind of conviction from one of Wall Street’s most-watched research desks doesn’t happen without specific reasons. Understanding the Goldman Sachs 2026 gold price target means understanding exactly what those reasons are, who is driving them, and where the actual risks sit.
How the Goldman Sachs 2026 Gold Price Target Evolved
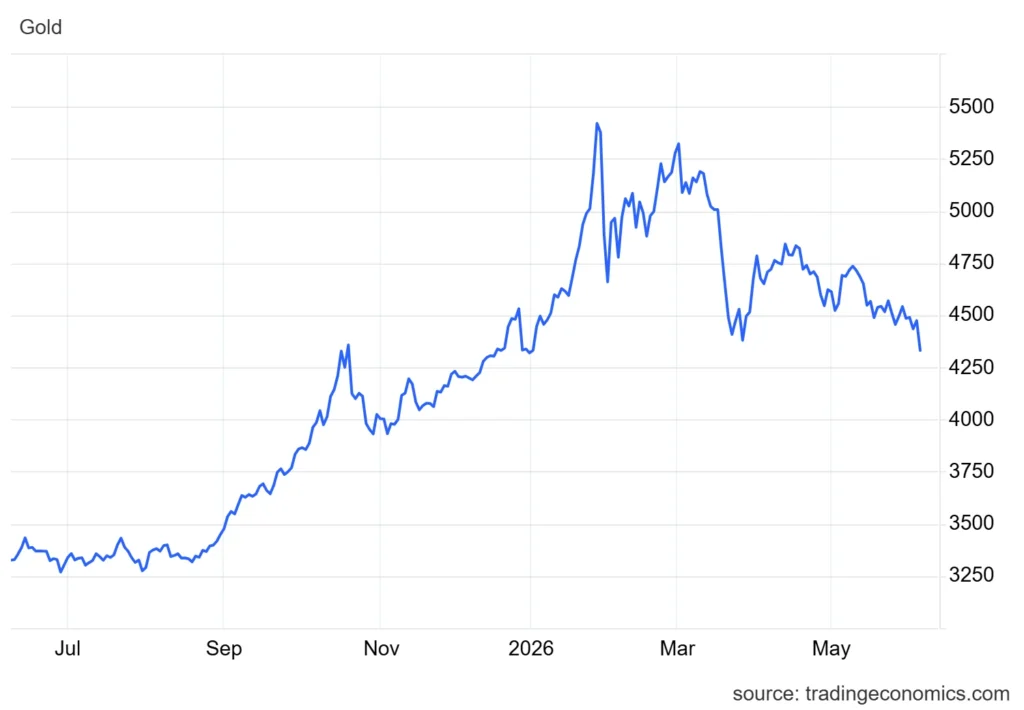
The number didn’t start at $5,400. In December 2025, Goldman Sachs was forecasting gold at $4,900 per ounce by year-end 2026 — a figure that already represented roughly 13% upside from where spot gold was trading at the time, around $4,323 per ounce.
Then something shifted faster than the model expected.
On January 21, 2026, Goldman Sachs analysts Daan Struyven and Lina Thomas published a note raising the December 2026 target to $5,400 per ounce — up from $4,900 — reflecting growing private-sector diversification into bullion on top of already-strong demand from central banks and ETFs. That’s a 10% upward revision made just weeks after the original forecast. The upgrade came shortly after gold briefly touched a record of around $5,589 in late January 2026, with prices holding above $5,000 and trading near $5,187 per troy ounce as of February 25.
And that’s the thing — Goldman wasn’t chasing the rally. The analysts were responding to a structural shift in who was buying gold and why.
The Three Structural Pillars Behind the Forecast
Goldman’s framework doesn’t rest on sentiment or momentum. It rests on three specific, trackable demand channels.

Source: Dr. Thomas Liptak, CC BY-SA 4.0 https://creativecommons.org/licenses/by-sa/4.0, via Wikimedia Commons
First: Central Bank Buying at Scale
Goldman expects total central bank buying to average 60 tonnes per month throughout 2026, with emerging market reserve managers continuing to diversify away from dollar-heavy holdings. For context, pre-2022 averages for annual central bank gold purchasing sat between 400 and 500 tonnes. Goldman’s 2025 and 2026 estimate is 760 tonnes annually — nearly double that historical baseline.
China’s central bank extended its gold-buying streak to 15 consecutive months through January 2026, underscoring the breadth of global demand from developing countries diversifying foreign exchange reserves away from the US dollar.
Practical consequence: if central banks represent the structural floor under gold prices, individual investors can’t easily push that floor away. Central banks don’t panic-sell on volatile trading days the way speculative funds do.
Second: Western ETF Inflows Above Rate-Cut Expectations
Western gold ETFs added roughly 500 tonnes since early 2025 — well above what rate cuts alone would have predicted — pointing to structural reallocation rather than purely tactical positioning.
Goldman estimated that 50 basis points of Fed cuts in 2026 would add approximately $120 per ounce of price support to gold. But the ETF inflows were already running hotter than that math justified. Goldman interpreted the excess as something new: high-net-worth individuals, family offices, and institutions buying gold not as a rate-cut play, but as long-term insurance.
Third: “Sticky” Private Investor Positions
This is the most important pillar — and the one most investors misunderstand.
Goldman analysts Struyven and Thomas pointed out that unlike previous short-term hedging positions established around single political events, such as the 2024 US election, the current rally sees private investors opting for more “sticky” gold allocations driven by long-term concerns over fiscal sustainability, central bank independence, and monetary stability.
Translation: these positions don’t unwind when a news cycle ends. They persist because the underlying concern — government debt sustainability and the integrity of fiat monetary systems — doesn’t resolve on any fixed date.
What Experts Say: Goldman’s Specific Risk Framework
Goldman Sachs strategists Lina Thomas and Daan Struyven acknowledged near-term downside risks explicitly, stating: “We view near-term risks to our gold price forecast as skewed to the downside, as gold remains vulnerable to further liquidation should Hormuz disruptions persist and bond or equity markets correct further.”
The March 2026 sell-off proved that point. After gold fell more than 10% in March 2026 — its biggest monthly decline since June 2013 — Goldman Sachs reaffirmed its $5,400 per ounce year-end target, with spot gold trading in the range of $4,567 to $4,769 as of early April, well below the all-time high.
Goldman’s base case for recovering to $5,400 rests on three drivers: normalization of speculative positioning (which the bank estimates is worth approximately $195 per ounce of price support), continuation of Fed rate cuts, and sustained central bank buying.
Investors who track gold closely know that pullbacks within a structural bull cycle often present the clearest entry windows — but timing those entries against a volatile macro backdrop is not straightforward.
Goldman’s $5,400 Target in Context: Wall Street Comparisons
Here’s something most retail investors don’t know: Goldman’s $5,400 target is actually the most conservative forecast among major banks currently covering gold.
JPMorgan raised its year-end target to $6,300 on February 2, per Reuters, projecting central bank and investor demand to average 585 tonnes per quarter through the year. Deutsche Bank reiterated a $6,000 target that same week. UBS raised its target to $6,200 for the first three quarters of 2026, with an upside scenario at $7,200.
Goldman’s framework centers on two primary data streams — central bank purchase volumes and ETF inflow rates — with the World Gold Council serving as the most reliable primary source for tracking those figures. The more aggressive forecasts from JPMorgan and UBS assume that private investor rotation out of equities and bonds into gold continues accelerating — Goldman’s base case does not require that new wave of buyers.
Past performance does not guarantee future results.
What People Get Wrong About the Goldman Forecast
The most common misreading is treating the $5,400 target as a price prediction for a specific date. Goldman is publishing a structural thesis, not a trading signal.
Following a decline of more than 10% in March 2026 — its steepest monthly drop since mid-2013 — Goldman reaffirmed the $5,400 target, signaling continued conviction in the underlying structural drivers despite the short-term volatility. The bank’s position is clear: the correction does not break the bull case.
Another common error: assuming that gold’s strong run signals a broader commodity supercycle. Goldman senior commodities analyst Lina Thomas addressed this directly on the firm’s Markets podcast published February 13, stating: “We’re not expecting a super cycle where prices will just go higher forever.” Gold is responding to monetary and fiscal risk. Base metals and energy respond to industrial demand cycles. These are different markets.
And there’s a third misconception — that Goldman’s data model was tracking central bank purchases accurately all along. In a note published May 18, Goldman analysts revealed that since August 2025, UK trade data had been systematically failing to capture gold leaving London’s vault network, meaning the bank’s model had been undercounting sovereign purchases for roughly eight months. Goldman’s nowcast of monthly central bank gold purchases for March 2026 was revised upward to approximately 50 tonnes per month, from a prior estimate of 29 tonnes — an upward revision of more than 72%.
Real central bank demand had been running hotter than Goldman’s own model showed. Not because banks were hiding activity, but because the data infrastructure itself had a gap. That discovery is significant: if anything, the structural case for gold was stronger than published data suggested during that period.
The Goldman Sachs 2026 Gold Price Target and What It Means for You
Goldman analysts Struyven and Thomas wrote: “The rally has accelerated since 2025 because central banks started competing for limited bullion with private sector investors.” That competition altered the starting point for prices — making sustained corrections less likely even if financial conditions stabilize.
Anyone who has studied gold markets understands that supply doesn’t respond quickly to price. Gold mining output can’t be doubled in six months. When demand from two distinct buyer bases — sovereign reserve managers and private investors — converges on the same asset simultaneously, supply constraints become a genuine price driver.
Central bank demand remains the key to Goldman’s bullish structural view, according to strategists Thomas and Struyven. And as of 2026, that demand shows no sign of reversing. The People’s Bank of China, along with other emerging market central banks, is treating gold as a permanent feature of reserve diversification — not a tactical trade.
Also Read: The 2000 Gold Dollar Value: Hidden Varieties Worth $550,000
FAQ
Has Goldman Sachs changed its gold price target during 2026?
Goldman Sachs raised its year-end 2026 gold price target twice. The bank moved from $4,900 to $5,400 per ounce in a note dated January 21, 2026, and has maintained the $5,400 target through the March 2026 correction and subsequent volatility.
Who are Goldman Sachs’ lead gold analysts behind the 2026 forecast?
The forecast is led by Daan Struyven and Lina Thomas, who authored the key notes on January 21 and subsequent updates. Lina Thomas also addressed the forecast publicly on Goldman’s Markets podcast on February 13, 2026.
Is Goldman’s $5,400 gold target the highest on Wall Street?
Goldman’s $5,400 target is actually the most conservative among major banks. JPMorgan’s target is $6,300, Deutsche Bank’s is $6,000, and UBS’s target is $6,200 with an upside scenario of $7,200.
What would cause Goldman to revise its gold forecast lower?
Goldman has identified two primary downside scenarios: a sharp Fed pivot toward rate hikes, or a sustained equity market rally that pulls capital away from defensive positions. Near-term, geopolitical disruptions to oil supply — as seen during the US-Iran conflict that began February 28, 2026 — can trigger short-term gold liquidations.
Does the Goldman Sachs forecast mean I should buy gold now?
Goldman’s research is a structural institutional analysis, not personal financial advice. The forecast reflects the bank’s view of demand drivers and price levels. Investment decisions depend on individual financial circumstances, portfolio composition, and risk tolerance. Always consult a qualified financial advisor before making any investment decisions.
This article is for informational and educational purposes only. It does not constitute financial advice. Always consult a qualified financial advisor before making any investment decisions.