This article is for informational and educational purposes only. It does not constitute financial advice. Always consult a qualified financial advisor before making any investment decisions.
Gold began 2018 with genuine momentum — then spent the rest of the year losing it. The 2018 gold price ended the year at $1,281.65 per troy ounce, down 1.15% for the full year, after hitting a high of $1,360.25 in January and a crushing low of $1,176.70 in August. For investors watching the metal closely, 2018 was a case study in how quickly macro forces can override safe-haven logic.
Here’s what actually happened — and why most people still misread it.
The January High That Never Held
Gold peaked at $1,356.23 per ounce on January 24, 2018 — a level many analysts at the time saw as a launchpad toward $1,400. The optimism wasn’t irrational. The US dollar was still relatively soft from 2017, global growth was synchronized, and geopolitical tension involving North Korea had put safe-haven demand on the table.
But the rally stalled almost immediately. And the reason is one investors often underestimate: the Federal Reserve.
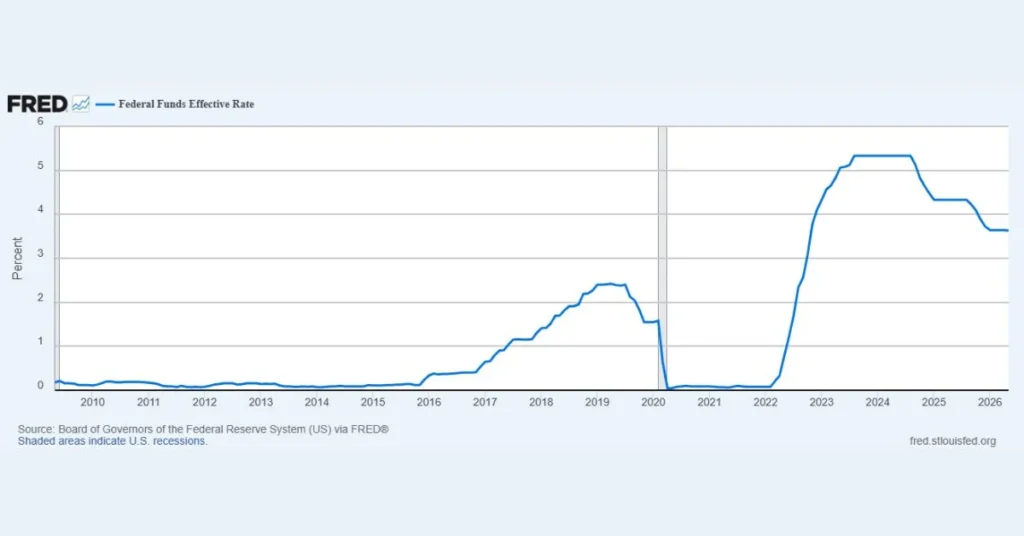
After raising rates three times in 2017, Wells Fargo and other major institutions projected the Fed would hike rates three more times in 2018. That forecast proved accurate. The Federal Open Market Committee raised rates in March, June, September, and December — four times in total — pushing the federal funds rate from 1.25% to 2.5% by year-end.
When the Federal Reserve raises the federal funds rate, interest rates across the economy typically increase, making the US dollar more attractive to investors and strengthening the currency. A stronger dollar then makes gold and silver more expensive for buyers using other currencies, which generally causes a decline in demand and lowers the prices of these precious metals.
The practical consequence for investors: anyone who held gold into mid-2018 without accounting for the Fed’s tightening cycle absorbed losses that were entirely foreseeable in hindsight.
What Experts Say: The Dollar Was the Real Story
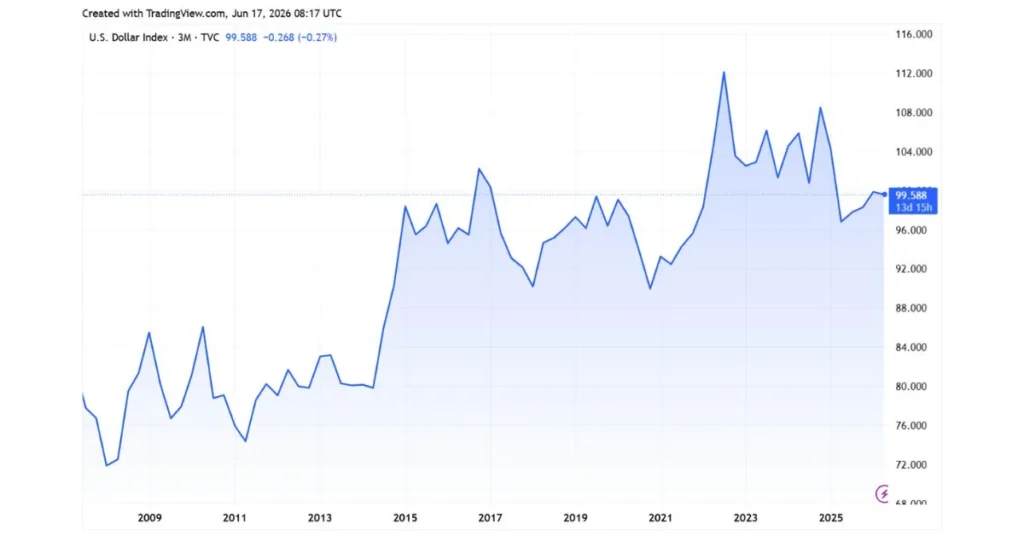
Anyone who tracked gold markets through 2018 knows the metal didn’t fall because sentiment turned on gold itself. It fell because the US dollar surged. The DXY — the dollar index measuring the greenback against a basket of six major currencies — climbed to a more than 13-month high above 96.98 in August 2018.
Naeem Aslam, chief market analyst at ThinkMarkets, stated at the time that gold was “firmly in a downtrend” driven primarily by the strength of the dollar index trading at “a significant level.”
The World Gold Council observed that “confrontational trade rhetoric and sanctions have so far played in favour of the US” — helping explain why gold failed to rally even as US-China trade tensions escalated through the year.
That’s the counter-intuitive part. A brewing trade war between the world’s two largest economies — the kind of event that textbooks say should send investors into gold — actually hurt the metal. The reason: trade fears pushed capital back into US dollar assets, not out of them.
Higher US rates tempted investor funds out of emerging markets and back into the US to take advantage of higher returns, in turn putting upward pressure on the dollar — which again worked against gold’s fortunes.
The August Collapse: When Emerging Markets Cracked
Gold’s worst single stretch came in August 2018 — and most retail investors didn’t see it coming.
On August 16, 2018, spot gold fell as much as 1.2% intraday to $1,159.96 per ounce — its lowest level since January 2017 — as the dollar held near a multi-year peak while concerns about a Turkish currency crisis and China’s economic health hammered emerging market currencies.
Simultaneously, the cost of dollar-denominated loans in emerging markets rose, signaling what one analyst described as a “dark undercurrent to America’s record-long prosperity.”
The Turkey crisis — where the lira collapsed nearly 40% against the dollar in 2018 — is the specific named event most investors overlook when reviewing this period. The US imposed tariffs on Turkish steel and aluminum in August, deepening Ankara’s currency crisis. And yet, rather than fleeing into gold, global investors piled deeper into dollar-denominated assets.
As US employers created 201,000 new jobs in August and year-over-year wages grew 2.9% — the fastest pace since June 2009 — the dollar index climbed 0.4% to 95.40, dragging gold lower in response.
That’s the practical lesson: in 2018, the dollar was functioning as the world’s safe haven — not gold.
What the Research Shows: Four Rate Hikes, One Direction
The World Gold Council’s post-2018 analysis confirmed what the price data showed in real time: the strong headwinds gold faced in 2018 were primarily driven by the strength of the US dollar, with combined uncertainty surrounding trade negotiations between China and the US contributing to dollar strength rather than gold demand.
When the US Federal Reserve hikes interest rates, this can have a profound effect on the gold price. A hike typically sees gold prices drop, while a decrease helps keep gold higher.
Four hikes in a single year — the most aggressive Fed cycle since 2005 — meant sustained headwind for gold across the full twelve months. The annual average closing price for gold in 2018 was $1,268.93 per ounce, while the year opened at $1,312.80 and closed at $1,281.65, representing an annual decline of 1.15%.
One thing the research reveals that surprises most investors: gold actually outperformed its fundamental models in 2018. Given the magnitude of dollar strength and the pace of rate hikes, many quantitative models predicted gold would fall below $1,150 — deeper than it actually did. Physical demand from India and China, particularly gold jewelry demand, absorbed enough supply-side pressure to limit the downside.
What People Get Wrong About 2018 Gold
The most common mistake investors make when looking back at 2018 is assuming gold “failed as a safe haven.” It didn’t. It behaved exactly as its relationship with the dollar and interest rates predicts — which is different from behaving as an emergency crisis hedge.
The gold–USD inverse relationship is not ironclad. In some crisis scenarios, gold and the dollar may both rise together. Other macro factors can dominate gold’s price and temporarily decouple it from the DXY, including rising real bond yields, which make non-yielding gold less attractive even when the dollar is weak.
In 2018, yields on US 10-year Treasuries rose from around 2.4% to nearly 3.2% by October. Holding gold — which pays no interest and no dividend — carried a rising opportunity cost all year. That’s not a safe-haven failure. That’s a yield-driven repricing.
Investors who ignored rising real yields and held gold purely for geopolitical protection paid the price. The lesson: gold’s safe-haven role activates most powerfully during deflationary crises and financial system stress — not during trade disputes that strengthen the reserve currency.
Monthly Price Snapshot: How 2018 Moved
Here’s a simplified breakdown of how the 2018 gold price evolved through the year:
- January: Year high of $1,360.25 — dollar still soft
- February–April: Gradual decline as dollar strengthened
- May–June: Gold fell to a 6-month low near $1,265 after Fed Chair Jerome Powell confirmed a continued rate-hike path
- July–August: Steepest losses; intraday low of $1,159.96 on August 16
- September–October: Partial recovery as dollar softened briefly, trade war fears resurfaced
- November–December: Stabilization; year closed at $1,281.65
The pattern is consistent: every dollar rally directly corresponded with a gold decline. No month broke that rule in 2018.
What 2018 Tells Investors Looking at 2026
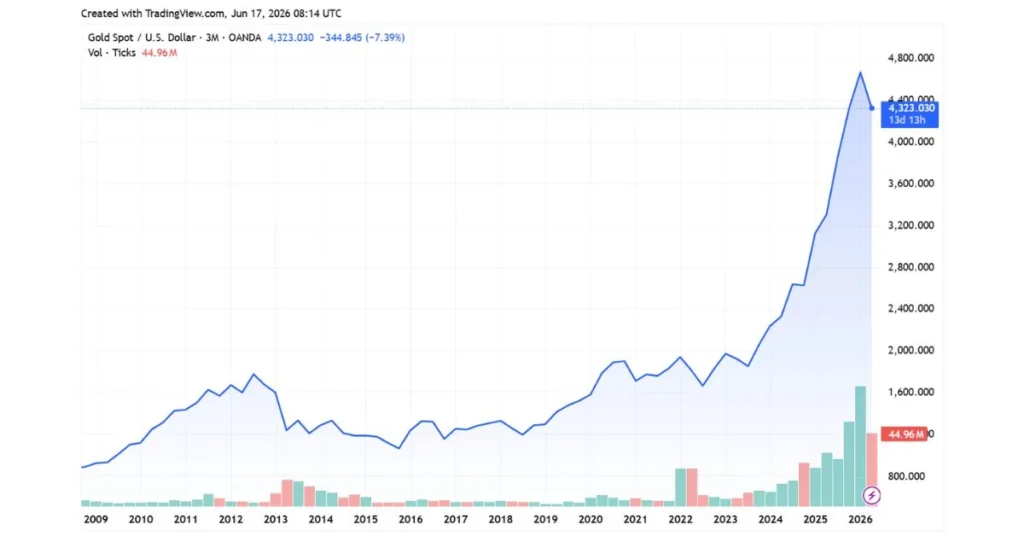
As of 2026, gold trades at levels more than three times higher than its 2018 average — a move driven by the exact conditions that suppressed it in 2018: a weaker dollar cycle, falling real yields, and surging central bank purchases. The Federal Reserve cut interest rates multiple times in 2025 and held rates steady at its January 2026 meeting, with policymakers signaling further cuts remain possible if economic growth slows.
Historically, gold’s price has risen significantly in the 24 months following Federal Reserve interest rate cuts, with notable gains of 31%, 39%, and 26% following cuts in 2000, 2007, and 2019 respectively.
That’s the mirror image of 2018. Understanding why gold fell then is arguably the clearest way to understand why the structural setup looks different now. Past performance does not guarantee future results.
The meta-lesson from 2018: gold doesn’t move on news. It moves on the dollar, real yields, and the opportunity cost of holding a non-yielding asset. Get those three right and the gold price becomes far more predictable.
Also Read: Gold Price 2016 Explained: The Year Gold Hit $1,372
FAQ
What was the average gold price in 2018?
The average closing price of gold in 2018 was $1,268.93 per troy ounce, with the year ending down 1.15%.
What was the lowest gold price in 2018?
The low point was $1,184.60 per ounce on August 23, 2018, though intraday prices briefly touched $1,159.96 on August 16 before recovering.
Why did gold fall in 2018?
Primarily because the Federal Reserve raised interest rates four times, pushing the US dollar index to a 13-month high. A stronger dollar makes gold more expensive for foreign buyers, reducing global demand and pressing the spot price lower.
Did the trade war between the US and China help gold in 2018?
No. Despite escalating tariffs and trade rhetoric, the conflict pushed capital into US dollar assets rather than gold. The World Gold Council noted that confrontational trade policy ultimately favored the dollar over safe-haven metals during this period.
How much did gold recover after 2018?
Gold rose 18.83% in 2019, averaging $1,393.34 per ounce for the year, then surged a further 24.43% in 2020 to average $1,773.73 — the beginning of a bull run driven by Fed rate cuts and pandemic-era monetary expansion.
This article is for informational and educational purposes only. It does not constitute financial advice. Always consult a qualified financial advisor before making any investment decisions. Past performance does not guarantee future results.