This article is for informational and educational purposes only. It does not constitute financial advice. Always consult a qualified financial advisor before making any investment decisions.
Gold price 2016 averaged $1,251.92 per troy ounce, a figure equivalent to about $1,715.21 in 2026 dollars once adjusted for inflation. That number looks almost modest next to where gold trades today, but it hides one of the more dramatic years gold has had this decade. Gold price 2016 still comes up constantly in investor research, and for good reason.
Here’s why it matters in 2026. That year, gold climbed off a multi-year low, took a direct hit from Brexit, and still finished positive, even while central banks were doing roughly the opposite of what they’re doing now. If you want to understand how gold actually behaves over a full cycle rather than just during a rally, 2016 is one of the better case studies available.
Gold Price 2016: The Numbers That Defined the Year
Here’s the headline number first. Gold opened the year at $1,078.47 on January 4, 2016, a price that JM Bullion’s ten-year chart marks as the lowest gold has touched in the past decade. By December 31, gold had settled at $1,150.90, up from the $1,060.20 close of 2015, a gain of just over 9%. The World Gold Council put the full-year move at up 8%, and that price action came alongside global gold demand rising 2% to 4,309 tonnes, the highest level since 2013.
Run the numbers and an investor who bought at the January low and held through year-end would have banked roughly a 7% gain in twelve months. That’s before counting the much sharper mid-year spike around Brexit.
The practical takeaway: 2016’s “up 8%” headline understates how much the price moved within the year. It’s a year-end snapshot of a much choppier ride, and that distinction matters for anyone using 2016 as a reference point.
Gold Price 2016: What Drove the Swings
Source: acediscovery, CC BY 4.0 https://creativecommons.org/licenses/by/4.0, via Wikimedia Commons
Gold price 2016 wasn’t a smooth climb. It was a series of shocks, and three events explain most of it.
The first was China and oil. In January 2016, worries about weakening Chinese economic growth and unrest in the Middle East pushed stock market investors toward gold as a safe haven, while oil hit a 12-year low. That combination kicked off the rally from January’s decade-low price.
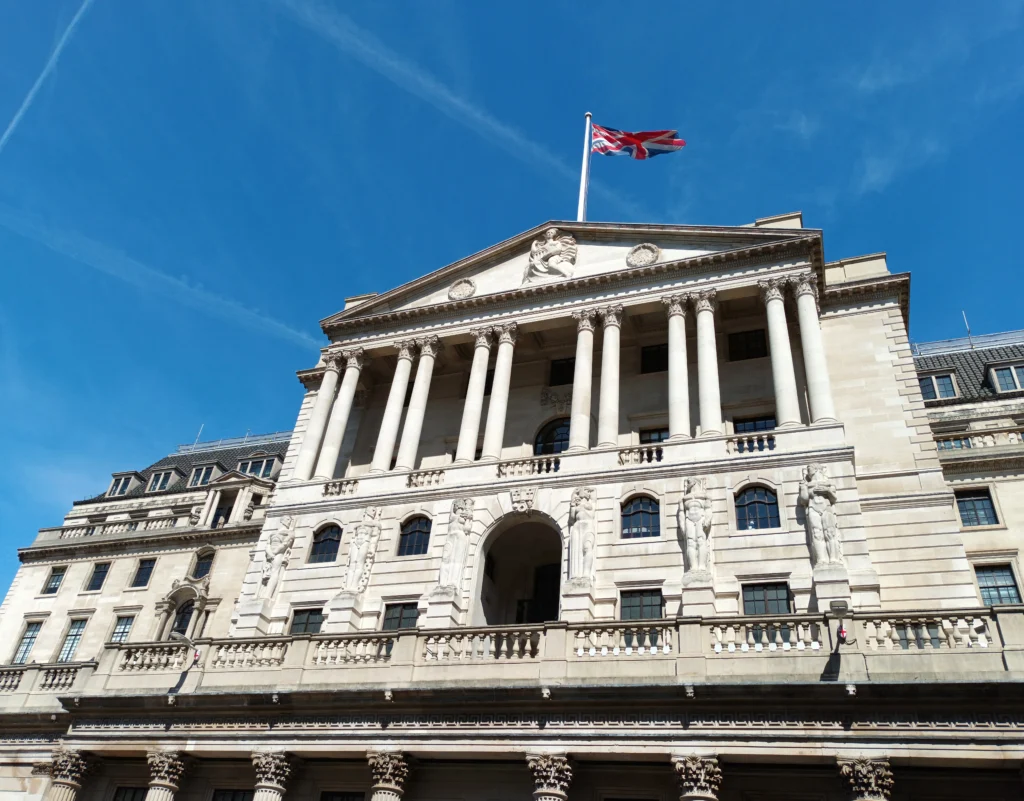
The second, and biggest, was Brexit. When the UK voted to leave the EU on June 23-24, 2016, spot gold spiked as much as 8% to peak at $1,358.20 an ounce, and gold ultimately traded around $1,336.66, a 6.3% jump in dollar terms, while searches for “buy gold” in the UK surged more than 500% according to The Telegraph. In sterling terms, gold ran from a 2016 low of £716 to a high above £1,055, a far bigger move than the dollar price shows on its own, because the pound was collapsing at the same moment.
The third was the US election. Gold actually climbed higher still, to $1,372.60 in August 2016, but gave back much of its 25% year-to-date gain in the fourth quarter once Trump’s conciliatory acceptance speech calmed markets. That pullback is part of why gold price 2016 charts look choppier than the year-end “up 8%” headline suggests.
What people get wrong here: they remember Brexit as “the day gold spiked” and assume there was time to react. There wasn’t, really. Most of the move happened overnight for investors outside the UK. By the time US markets opened properly, a large chunk of the gain was already priced in.
How 2016’s Gold Price Stacks Up Against Today
Gold price 2016 numbers look almost frozen in time next to 2026. The 2016 average of $1,251.92 per ounce works out to roughly $1,715 in 2026 dollars after adjusting for inflation using the Consumer Price Index. Call that the “if gold had just tracked inflation” number.
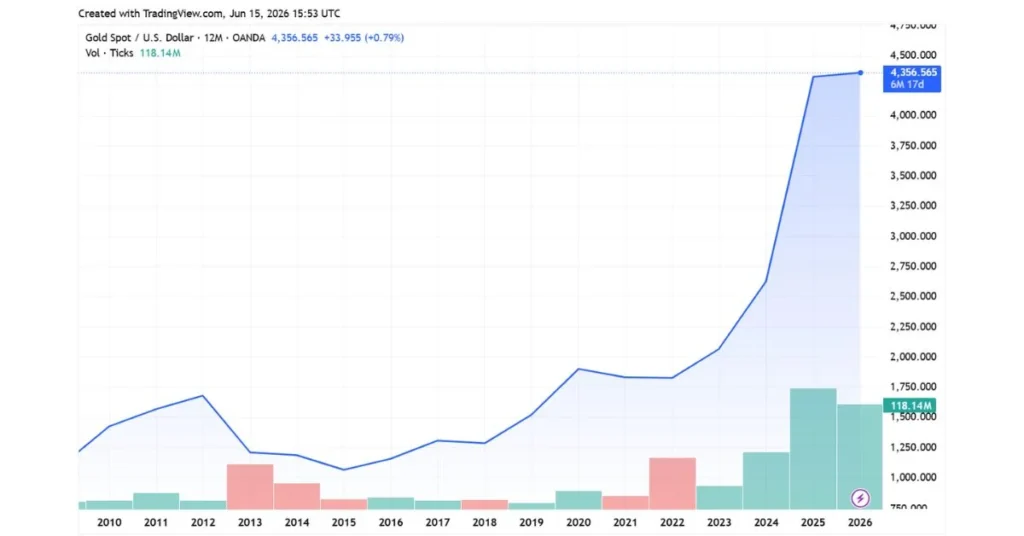
Gold hasn’t just tracked inflation. As of late 2025, gold had gained over 60% in a single calendar year, based on the LBMA Gold Price as tracked by the World Gold Council, and by mid-2026 gold trades at a multiple of that inflation-adjusted figure. Do the simple math and an investor who bought at the 2016 average and held through today is sitting on a nominal gain well above 200%, with a real chunk of that being inflation-beating return, not just currency debasement.
Here’s the part that surprises people. 2016 wasn’t even a standout year for the usual reasons. Central bank gold demand actually fell 33% that year, to 384 tonnes, as foreign exchange reserve pressures mounted on many governments. That’s the opposite of the central-bank-driven story dominating 2025 and 2026 coverage. Gold rose anyway, on ETF inflows and safe-haven flows around Brexit and the US election. Different decade, different driver, same asset.
What the Data Shows About 2016 as a Turning Point
Investors who track gold closely know 2016 wasn’t only a price story. It was the year the gold market’s buyer base started shifting, and the demand data backs that up.
Global gold demand rose 2% in 2016 to 4,309 tonnes, the highest level since 2013, driven by ETF inflows of 532 tonnes, the second-highest year on record and the strongest since 2009. Bar and coin demand stayed roughly flat at 1,029.2 tonnes for the year, but Q4 alone saw China’s strongest quarter for bar and coin buying since Q2 2013, as retail buyers used the post-Brexit pullback as their entry point.
On the supply side, mine production held steady at 3,236 tonnes, virtually unchanged from 2015, while recycling jumped 17% to 1,308.5 tonnes as higher prices through the first three quarters pulled old jewelry and scrap back into circulation.
Anyone who has studied gold markets understands what that combination means. 2016 was an institution-led recovery, with ETF money moving first and retail demand catching up later in the year. That’s roughly the reverse of the 2011-2012 peak, when retail demand led and institutions followed.
What People Get Wrong About Gold Price 2016
The biggest misconception is treating “ended the year up 8%” as the whole story. It wasn’t.
Mistake one: assuming central banks drove the 2016 rally. They didn’t. Central bank gold demand fell 33% to 384 tonnes that year, the opposite of the narrative that dominates 2026 headlines. ETFs and safe-haven flows did the heavy lifting instead.
Mistake two: assuming Brexit marked the year’s high. It didn’t. The Brexit-day peak of $1,358.20 was actually below the $1,372.60 high reached two months later, in August.
Mistake three, and this is the one that catches long-term holders off guard: anyone who bought near that August 2016 peak and held until year-end was sitting on a loss for roughly four months, even in a year that finished positive. The “up 8%” figure smooths over a stretch that, at the time, felt like a much worse year than the final number shows.
If you’re studying gold price 2016 to understand how gold behaves, the lesson isn’t “gold went up that year.” It’s that annual returns and the lived experience of holding the asset are two different things.
Also Read: Rhodium Price vs Gold: The Shocking Gap Explained
FAQ
Was 2016 a good year for gold?
Gold price 2016 ended the year up roughly 8% to 9%, recovering from a decade low touched in January, according to World Gold Council data.
What was the average gold price in 2016?
Gold averaged $1,251.92 per troy ounce in 2016, equal to roughly $1,715 in 2026 dollars after adjusting for inflation.
Did gold reach $1,400 an ounce in 2016?
No. Gold’s highest point in 2016 was about $1,372.60 per ounce in August, falling short of $1,400 before retreating in the fourth quarter.
Did gold prices spike after the Brexit vote in 2016?
Spot gold jumped as much as 8% within hours of the June 2016 referendum result, as investors moved into safe-haven assets while the British pound fell sharply.
Is the gold price in 2026 higher than in 2016?
By a wide margin. Gold’s 2016 average of $1,251.92 per ounce compares to prices several times higher as of mid-2026, even after accounting for inflation.
The Bottom Line
Gold price 2016 matters as a benchmark. It’s the year gold climbed off a multi-year low, survived Brexit, a Chinese growth scare, and a US election, and still finished positive, all while central banks were net sellers relative to their own reserves. A decade later, the structural story has flipped. Central banks are now the buyers, not bystanders.
The lesson from 2016 still holds, though. Annual numbers hide monthly drawdowns. Currency moves can dwarf the headline dollar price. And the catalysts that move gold rarely look the same two cycles in a row.
If you’re using gold price 2016 as a reference point, anchor it to two numbers: $1,251.92 average, and roughly $1,715 in inflation-adjusted 2026 terms. Everything else is context.
This article is for informational and educational purposes only. It does not constitute financial advice. Always consult a qualified financial advisor before making any investment decisions.