This article is for informational and educational purposes only. It does not constitute financial advice. Always consult a qualified financial advisor before making any investment decisions.
Here’s a number that stops most people mid-scroll: gold has gained over 70% since mid-2025, while the S&P 500 is up roughly 10% to 11% year-to-date in 2026. The sp500 vs gold debate isn’t really about which one is “better.” It’s about what each one is actually for, and the 2026 numbers make that distinction sharper than usual.
Sp500 vs Gold: What’s Actually Happening in 2026
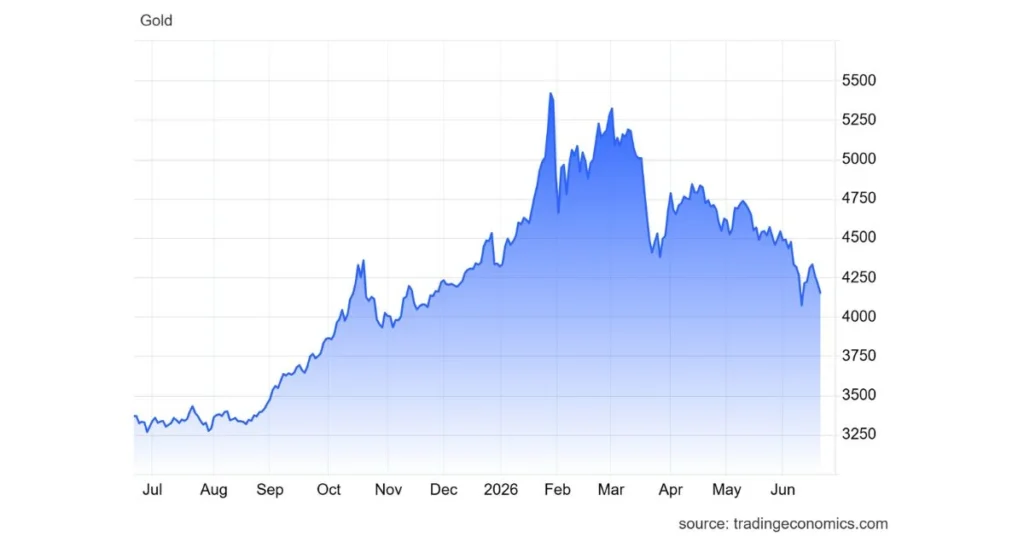
Gold has been trading in the $4,200 to $4,350 per ounce range through mid-June 2026, according to live pricing tracked by Trading Economics and USAGOLD, after pulling back from January’s record highs. The metal touched an intra-year floor near $4,170 in the spring before recovering. Meanwhile, the S&P 500 closed at a fresh record on the final trading day of May 2026, part of a broader rally across all three major U.S. indexes driven by AI-linked earnings.
That’s the part most sp500 vs gold comparisons skip: 2026 hasn’t been a “pick a winner” year. Both have set records. The interesting question is why — and what happens next time they don’t move together.
The Gold-to-S&P 500 Ratio: The Number Nobody Talks About
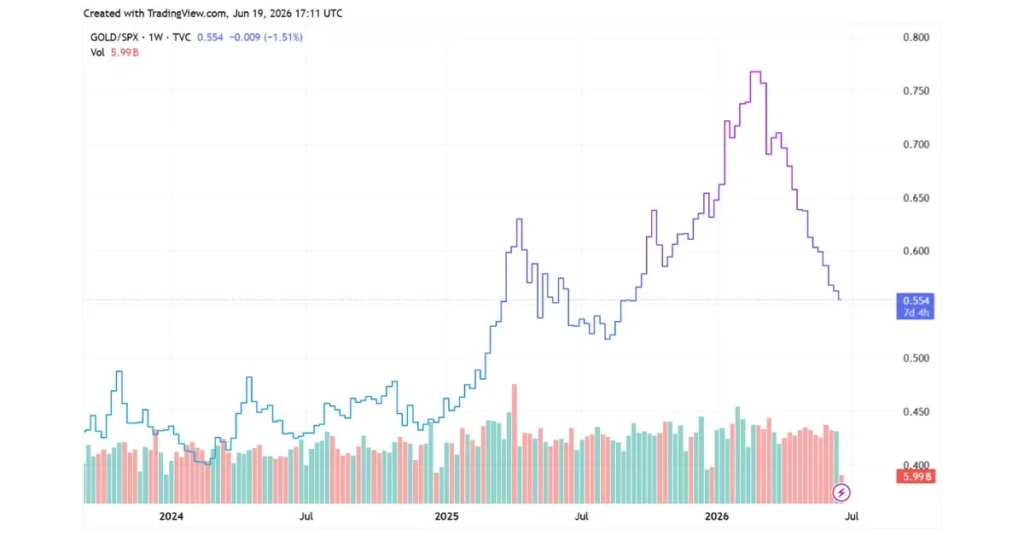
Most investors track gold’s dollar price and the S&P’s point level separately. Few track the ratio between them, but analysts at firms like Wells Fargo Investment Institute use it as a signal for relative value. When the ratio climbs, gold is getting expensive relative to stocks. When it falls, stocks are pulling ahead.
CNBC reported in January 2026 that the S&P 500’s value relative to gold crossed a historically significant threshold — and noted that in prior instances when this happened, the S&P 500 went on to trade range-bound for years afterward. That’s not a prediction. It’s a documented historical pattern, and it’s exactly the kind of data point that gets buried under daily price headlines in most sp500 vs gold writeups.
What people get wrong here: they assume a rising stock market and a rising gold price can’t both be “healthy” signals at once. They can — but historically, when gold strongly outpaces equities over a sustained stretch, it’s often a signal that investors are quietly hedging against currency weakness, not just chasing a commodity rally. The dollar index has fallen more than 10% over the trailing 12 months as of early 2026, per CNBC’s reporting, and that currency move is doing a lot of the work behind gold’s strength.
Sp500 vs Gold: Long-Term Returns Tell a Different Story
From 2000 through early 2026, the S&P 500’s compound annual growth rate — including reinvested dividends — has averaged approximately 10.1%, according to data compiled by VT Markets. Gold delivered roughly 8.2% annually over the same period. On paper, stocks win the long race in this sp500 vs gold matchup.
But that average hides the years that actually matter to most investors: the crash years. Gold has historically outperformed the S&P 500 in 29 out of the last 55 years when its yield-equivalent return is factored in, according to analysis from Monetary Metals. Those 29 years cluster around exactly the periods when stock portfolios were getting hit hardest — 2000-2002, 2008, and now the current stretch of monetary and geopolitical uncertainty.
Here’s the practical consequence: if your entire retirement account is in an S&P 500 index fund and a 2008-style event hits five years before you planned to retire, the math doesn’t average out for you personally. It happens in real time, to your actual balance.
Why Wealth Managers Don’t Treat This as Either/Or
Most top-tier wealth managers suggest a gold allocation of just 5% to 10% within a broader portfolio, not as a replacement for equities. The goal isn’t for gold to beat the S&P 500. It’s for gold to move up when stocks move down — what’s called negative correlation. In a high-volatility 2026 environment, a 10% gold allocation can reduce a portfolio’s maximum drawdown by as much as 25%, based on modeling cited by Calcix.
That’s a structural argument, not a forecasting one. And that’s the thing — most retail investors treat the sp500 vs gold question like a tournament bracket, when professionals treat it like a recipe with two ingredients that serve different functions.
What Wall Street’s Gold Desk and Buffett’s Index Advice Actually Disagree On
J.P. Morgan Global Research’s Greg Shearer, head of Base & Precious Metals, described gold in mid-2026 as stuck in “a bit of a technical no-man’s land” — trading above its 200-day moving average near $4,340/oz but capped below its 50-day moving average around $4,730/oz. J.P. Morgan’s house forecast pointed to gold reaching $6,000/oz by the end of 2026, with $6,300/oz possible in 2027, though Shearer was clear this depends on Fed policy and geopolitical resolution, neither guaranteed.
On the equity side, Warren Buffett has long advised everyday investors to simply hold an S&P 500 index fund rather than try to beat the market. The Motley Fool noted in 2026 that gold has actually outperformed the S&P 500 by 120 percentage points since Buffett’s comment — a reminder that even in the sp500 vs gold debate, widely-trusted long-term advice can look wrong over specific stretches, even if it holds up over decades. Past performance does not guarantee future results.
Income vs. No Income: The Difference That Compounds Quietly
This is the part that gets glossed over in most comparisons. The S&P 500 generates income through dividends, currently averaging around a 1.5% yield in 2026. Gold generates zero yield on its own; holding it actually costs money once you factor in storage and insurance, what’s known as negative carry.
Over a 20-year holding period, even a modest 1.5% dividend yield compounding alongside price appreciation can result in a difference of hundreds of thousands of dollars compared to a static gold position, according to modeling from Calcix. That’s the counter-intuitive insight at the heart of any honest sp500 vs gold analysis: gold’s headline price gains look more dramatic year to year, but the quiet compounding of reinvested dividends is doing real work in the background for equity holders that a gold price chart simply doesn’t show.
Current Market Drivers Behind the 2026 Numbers
A few specific events are shaping both sides of this comparison right now. New Federal Reserve Chair Kevin Warsh held rates unchanged at his inaugural FOMC meeting in June 2026 but signaled that roughly half of FOMC members see a possible rate hike later this year, driven by inflation concerns tied to the Middle East conflict. Higher rate-hike odds pushed Treasury yields up, which raised the opportunity cost of holding non-yielding gold — and gold fell nearly 2% in the session immediately following that signal, per Trading Economics.
At the same time, the U.S. and Iran digitally signed an interim peace agreement in mid-June 2026, with a formal signing ceremony scheduled in Switzerland. That eased some geopolitical risk pricing, which matters for gold specifically, since safe-haven demand had been a major support for prices through the spring.
For stocks, the AI-driven earnings story has been the dominant force. The “Magnificent Seven” stocks — representing roughly one-third of the S&P 500’s total market cap — have driven much of the index’s gain, with Nvidia, Alphabet, and Apple alone up 14% to 15% in 2026 and carrying a combined market cap near $14 trillion, according to Motley Fool reporting. That’s a concentration risk worth knowing: a large share of “the S&P 500’s” 2026 performance is really a handful of companies’ performance, which changes the sp500 vs gold comparison more than most headlines admit.
Who Should Actually Care About the Sp500 vs Gold Question
If you’re decades from retirement and building wealth, the historical CAGR data favors leaning equity-heavy — the S&P 500’s long-run compounding, especially with dividends reinvested, has outpaced gold over most 20+ year stretches.
If you’re within 5-10 years of needing the money, or you’re already retired and drawing down a portfolio, the drawdown-reduction math behind a small gold allocation becomes more relevant. Losing 25% less during a downturn matters a lot more when you don’t have decades left to recover.
Investors who track gold markets closely know that timing a single best asset is far less reliable than holding the right mix for your actual time horizon. Anyone who has watched a portfolio through 2008 or 2020 understands that the sp500 vs gold question isn’t really about maximizing the best year. It’s about surviving the worst one without being forced to sell at the bottom.
Also Read: Bullion com Reviews: Surprising Facts Before You Buy
FAQ
Is gold a better investment than the S&P 500 in 2026?
No single answer fits everyone. Gold has outpaced the S&P 500 over the trailing three years and gained roughly 70% since mid-2025, but the S&P 500’s long-run compound annual growth rate of about 10.1% since 2000 has historically outpaced gold’s 8.2% over the same period.
Should I replace stocks with gold in my portfolio?
No. Wealth managers typically recommend a gold allocation of just 5% to 10%, used to reduce portfolio volatility, not to replace core equity holdings that drive long-term growth.
Does gold pay dividends like S&P 500 stocks?
No. Gold generates no yield and carries storage and insurance costs, known as negative carry, while the S&P 500 currently yields around 1.5% in dividends that compound over time when reinvested.
Will gold reach $6,000 per ounce in 2026?
This is not guaranteed. J.P. Morgan Global Research has forecast gold averaging $6,000/oz by late 2026, but this depends on Fed policy decisions and unresolved geopolitical conflicts.
Does gold always outperform stocks during a recession?
No, not always, but historically gold has outperformed the S&P 500 in 29 of the last 55 years when factoring in a yield-equivalent return, with many of those years clustering around major market downturns like 2000-2002 and 2008.
This article is for informational and educational purposes only. It does not constitute financial advice. Always consult a qualified financial advisor before making any investment decisions. Past performance does not guarantee future results.