This article is for informational and educational purposes only. It does not constitute financial advice. Always consult a qualified financial advisor before making any investment decisions.
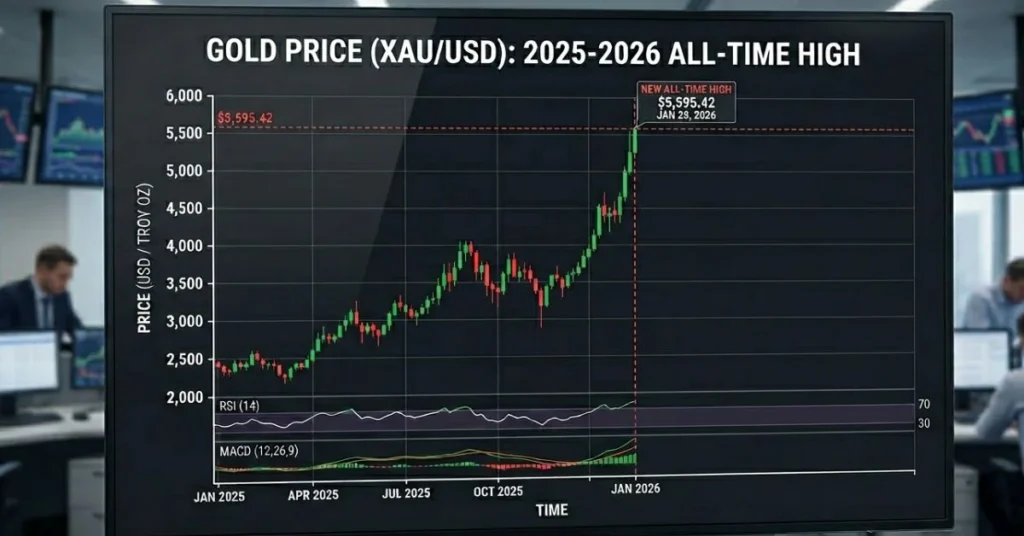
Gold hit an all-time high of $5,595 per troy ounce on January 28, 2026. By mid-April, it had dropped roughly 15%. No disaster. No crash. Just the same forces that have always moved gold — working exactly as they’re supposed to. Understanding why gold price goes up and down is less about predicting the next move and more about reading which force is currently winning.
Most people guess wrong because they think gold moves randomly. It doesn’t. Every major swing traces back to one of five measurable drivers — and once you see how they connect, the volatility stops feeling like noise.
The Interest Rate Trap: How the Federal Reserve Pulls Gold’s Strings
Gold pays no interest. No dividend. No coupon. That single fact determines more of its price behavior than anything else.
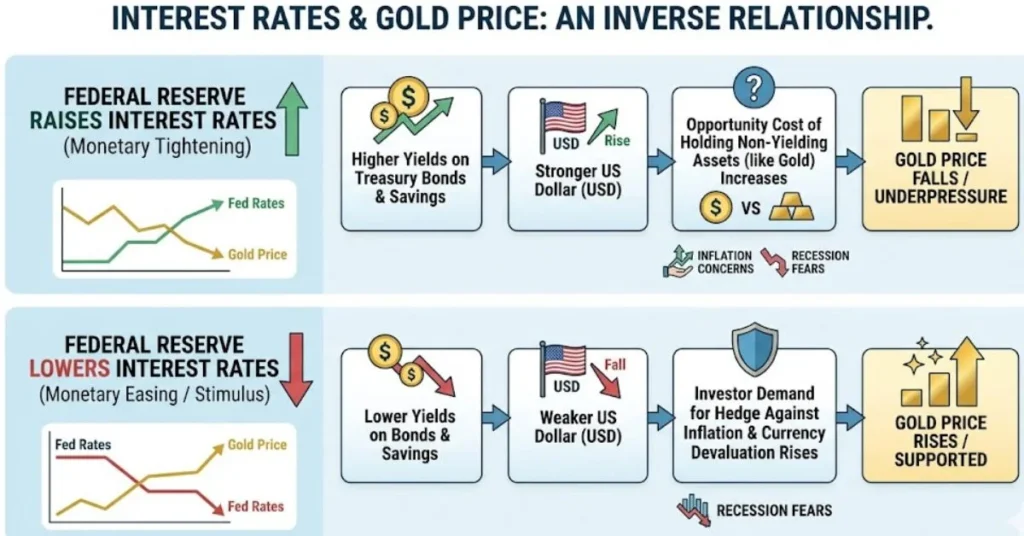
When the Federal Reserve raises interest rates, it makes dollar-denominated, yield-bearing assets like bonds more attractive. Since gold doesn’t pay interest, investors shift capital toward higher-yielding options, putting downward pressure on gold prices. The math is simple: if a Treasury bond pays 4.5%, why hold gold at 0%?
In March 2026, the Fed trimmed its 2026 rate cut projections from two cuts to one, citing hotter-than-expected producer inflation — February’s PPI came in at +0.7%, well above consensus. The 10-year Treasury yield jumped to 4.2%, and gold repriced accordingly. That single Fed signal knocked gold through $5,000 in two sessions.
Here’s what most investors miss: the anticipation of rate changes moves gold before the actual cut or hike happens. When traders started pricing out rate cuts in early 2026, gold sold off — even though the Federal Reserve hadn’t actually done anything yet. Market expectations do the heavy lifting. Wait for the official announcement and you’re already late.
The practical consequence: if you hold gold and the Fed signals it’s done cutting, your position faces immediate headwind — regardless of what’s happening anywhere else in the world.
Why a Strong U.S. Dollar Drags Gold Down
The U.S. dollar and gold share an inverse relationship most of the time. When the dollar strengthens against other currencies, gold prices typically fall. When the dollar weakens, gold usually rises.
The mechanism is direct. Gold is priced globally in dollars (the symbol XAU represents one troy ounce in international markets). When the dollar weakens, gold becomes cheaper for international investors, boosting purchases and prices. A Japanese buyer, an Indian importer, a European pension fund — they all buy gold in dollars. Cheaper dollars means more buying power. More buying pressure means higher prices.
The DXY–gold inverse correlation historically runs at -0.82. That’s an exceptionally tight relationship. And in 2025, it actually strengthened: each DXY point of decline added closer to $50–55 to gold’s price, compared to a $37.50 average in earlier periods.
What’s counterintuitive here: this relationship occasionally breaks. Gold has behaved alongside a relatively strong U.S. dollar at points in 2026, challenging long-held assumptions. When that happens, it usually means a third force — geopolitical fear or central bank demand — is overriding the dollar correlation. Not a rule change. An override. The inverse relationship reasserts itself once the crisis passes.
Central Banks: The Structural Floor Nobody Talks About Enough

Individual investors watch charts. Central banks buy tonnes. The scale difference matters enormously.
Central bank purchases of 863 tonnes in full-year 2025 reached the upper end of expected ranges and remain historically elevated and geographically widespread. The National Bank of Poland was the largest single buyer for the second consecutive year, adding 102 tonnes in 2025 alone.
According to the World Gold Council’s Gold Demand Trends report published April 29, 2026, central banks purchased a net 244 metric tonnes during Q1 2026 — a 3% increase year-over-year and a 17% jump from Q4 2025’s 208 tonnes. That’s sovereign money buying gold at the fastest quarterly pace in over a year, at prices near all-time highs.
Why? The U.S. dollar’s gold-purchasing power was effectively halved between January 2025 and January 2026, a deterioration mirrored across ten major fiat currencies according to World Gold Council data. Countries aren’t sentimental about gold — they’re responding to the erosion of dollar-denominated reserve value.
Anyone who has studied gold markets understands what sustained sovereign buying does: it creates a floor. When speculative traders sell, central banks absorb. That structural demand is one reason the gold price goes up reliably over long horizons even when short-term volatility is brutal. Past performance does not guarantee future results, but the structural demand case here is different from retail speculation.
Inflation, Real Yields, and What the Textbooks Get Wrong
Gold’s reputation as an inflation hedge is real — but the mechanism is more specific than people think.
It’s not inflation itself that drives gold. It’s real interest rates — the difference between the nominal rate and inflation. When inflation runs higher than bond yields, real yields turn negative. A bond paying 4% when inflation is 5% is actually destroying purchasing power. In that environment, gold — which preserves purchasing power — becomes comparatively attractive.
The April 2026 CPI print came in above forecasts at 3.8% — the highest since May 2023 — with real average hourly wages turning negative for the first time since April 2023, according to the Bureau of Labor Statistics. Energy costs drove much of that pressure: energy costs were up 17.9% year-on-year as of May 2026.
The textbook gets this wrong by treating gold as a simple inflation hedge. Gold doesn’t move with CPI — it moves with the gap between CPI and Treasury yields. Close that gap (raise rates faster than inflation rises), and gold stalls or falls. Widen it, and gold accelerates. Tracking the TIPS (Treasury Inflation-Protected Securities) yield gives a sharper leading indicator than the CPI headline alone.
Geopolitical Shocks: Fast Up, Then Complicated
Crises push money into gold fast. Everyone knows this. What surprises people is how quickly that trade reverses — and why.
Gold often rises during periods of geopolitical stress, but the reaction isn’t always immediate. The gold price drop in March 2026 is a clear example — Iran’s Strait of Hormuz threats sent crude oil surging, yet gold initially sold off as dollar strength squeezed leveraged traders.
As of May 2026, spot gold was navigating a complex bearish trend despite the ongoing conflict in Iran. Although geopolitical strife typically bolsters safe-haven assets, the metal fell after the conflict began in February — partly because a severe liquidity squeeze across global markets forced investors to offload gold to cover losses elsewhere.
This is the part nobody tells new investors: in an acute crisis, gold sometimes drops first. Margin calls force liquidation across all asset classes. Traders sell what they can, not what they want to. Gold is liquid. It gets sold. Once the panic clears and the dust settles, safe-haven buying resumes. The traders who panic-sold during the initial dip miss the subsequent recovery.
What the Research Shows: Supply, Mining, and the Physical Market
The London Bullion Market Association (LBMA) manages the global benchmark through the twice-daily London Fix — the reference price used by producers, refiners, and central banks worldwide. Behind every price move is a physical market where supply constraints matter.
Global gold demand surged past 5,000 tonnes in 2025 for the first time on record, driven by a historic wave of investment inflows and sustained central bank buying, according to the World Gold Council’s Gold Demand Trends report.
Supply hasn’t kept up. Mine output grows slowly — a new gold mine takes seven to ten years from discovery to production. Mine supply and recycled gold are likely to reach similar levels to those in 2025, with miners incentivised by high margins and recycling firm but constrained. High prices push up recycling — people sell old jewelry — but that extra supply is limited. It can’t match a 42% surge in demand the way a factory can scale production.
Total gold demand in Q1 2026 reached 1,231 tonnes worth a record $193 billion — up 74% in value year-on-year. Bar and coin demand rose 42% to 474 tonnes, the second-highest quarterly total ever recorded, according to the World Gold Council Q1 2026 Gold Demand Trends report. When the price dropped in early 2026, physical buyers didn’t retreat. They stepped in harder. That’s the physical market behaving as a price anchor.
What People Get Wrong About Why Gold Price Goes Up and Down
The most common mistake: treating gold like a stock.
Stocks have earnings. Earnings grow or shrink. Valuation is anchored. Gold has no earnings. Its value is entirely relative — relative to the dollar, relative to bond yields, relative to confidence in governments and financial systems. When confidence holds, gold drifts. When confidence cracks, gold reprices sharply.
The second mistake: confusing short-term corrections with trend reversals. Short-term corrections are common in the gold market, particularly after strong rallies. These movements often reflect trading activity and liquidity conditions rather than long-term changes in gold’s role as a hedge or safe-haven asset. A 15% pullback after a 65% annual gain is not a collapse. It’s a market breathing.
The third mistake — and this one is expensive: chasing gold after a geopolitical spike. Buying fear-driven peaks means buying other people’s panic premium. The price often retreats once the immediate risk fades, even if underlying fundamentals remain bullish.
Practical Consequences: What This Means for You
Five forces move gold price up and down: interest rates, U.S. dollar strength, central bank demand, inflation relative to real yields, and geopolitical risk. They don’t all point the same direction at the same time. That’s the actual source of volatility.
If you skip tracking real yields and watch only headline CPI, you’ll misread the direction gold is likely to move. If you panic-sell during a liquidity crisis, you may exit right before the safe-haven bid returns. And if you assume geopolitical crises always mean gold goes up immediately, March 2026 taught the market an expensive lesson.
As of 2026, the structural forces — central bank accumulation, dollar reserve diversification, persistent inflation — remain intact. Short-term factors — dollar strength, Fed posture, energy inflation — create the volatility. Understanding which layer you’re looking at determines whether a price move looks like an opportunity or a threat.
FAQ: Why Gold Price Goes Up and Down
Does the gold price move every day?
Yes. Gold trades 24 hours a day across global markets including COMEX in New York, the LBMA in London, and exchanges in Shanghai and Dubai. The spot price updates continuously based on live supply and demand.
Does rising inflation always push gold prices higher?
No. What matters is real yields — the gap between inflation and interest rates. If rates rise faster than inflation, real yields stay positive and gold can fall even with high CPI. Gold benefits most when inflation runs above bond yields.
Is gold safe to hold when the stock market crashes?
Generally yes, but not always immediately. During acute market crashes, gold sometimes sells off in the first days as investors liquidate everything to cover margin calls. The safe-haven bid typically returns within weeks once liquidity stress eases.
Do central banks buying gold push prices up?
Yes. Central bank purchases represent structural, non-speculative demand that doesn’t reverse quickly. When the World Gold Council reported 244 tonnes of central bank buying in Q1 2026 alone, that volume absorbs supply that would otherwise keep prices lower.
Does a stronger U.S. dollar always make gold fall?
Usually, but not always. The inverse DXY–gold correlation historically sits around -0.82, but during periods of extreme geopolitical fear or de-dollarization pressure, both can rise simultaneously. The correlation is reliable over months — less so during acute crisis hours.
This article is for informational and educational purposes only. It does not constitute financial advice. Always consult a qualified financial advisor before making any investment decisions. Past performance does not guarantee future results.